Skip to content

DataLumio Blogs

Engaging readers across the globe, from students and researchers to enthusiasts and professionals.

  • X
  • Facebook
  • LinkedIn
  • Home
  • Explore More
  • Privacy Policy

Month: August 2026

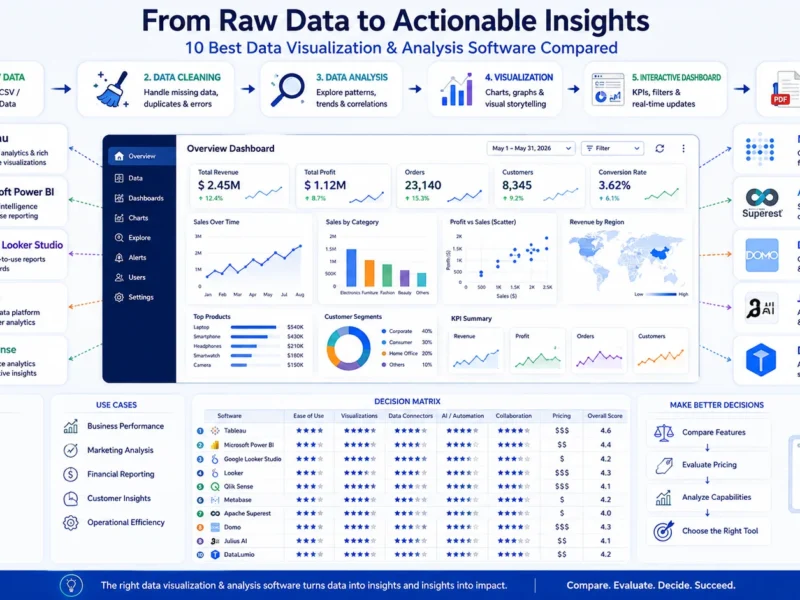
Comparison of data visualization software showing datasets transformed into charts, dashboards, analysis, and reports.
Data Visualization

Best Data Visualization Software in 2026: 10 Tools Compared for Dashboards, Analysis, and No-Code Use

Choosing data visualization software is not really about finding the tool with the most

August 18, 2026August 18, 2026
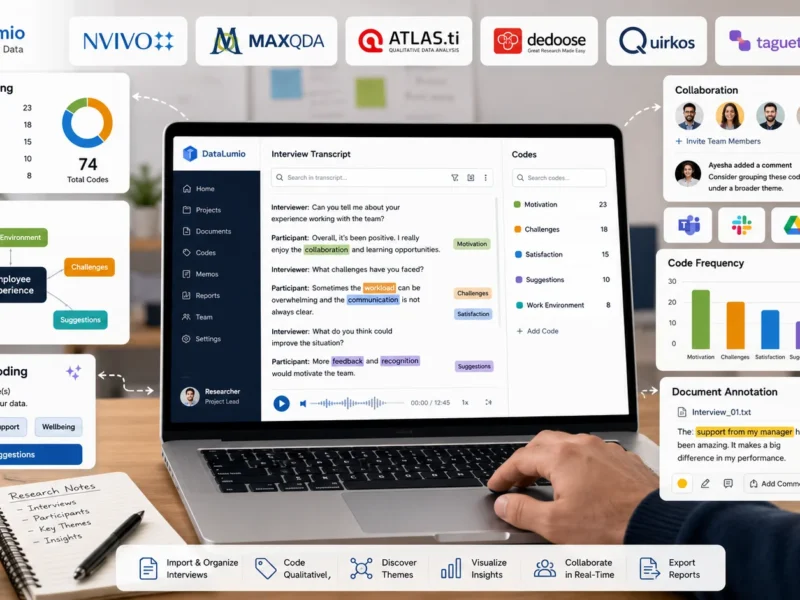
07 Best Qualitative Data Analysis Software
Qualitative Data Analysis

Best Qualitative Data Analysis Software in 2026: 07 QDA Tools Compared for Coding, Interviews, Thematic Analysis, and Free Use

Introduction Qualitative research is built on understanding experiences, opinions, behaviors, and stories that numbers
August 13, 2026August 13, 2026
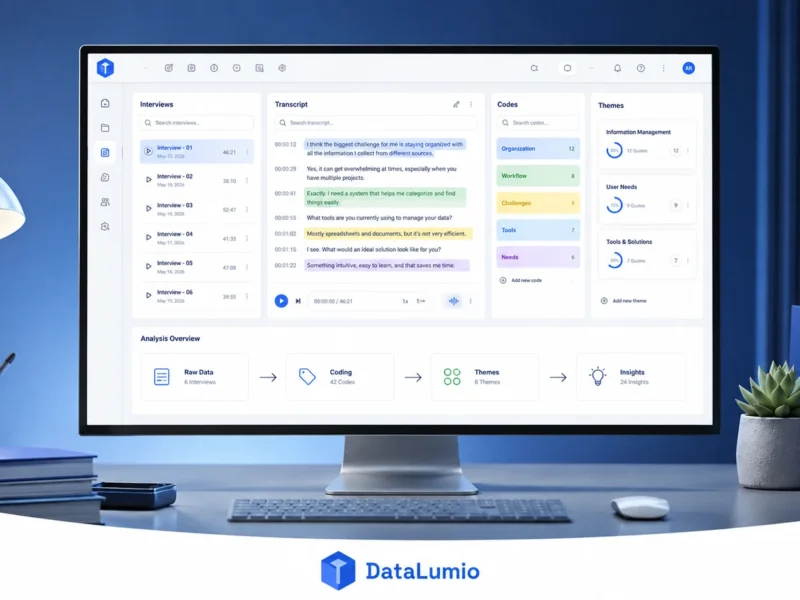
Qualitative data analysis software interface designed for easy learning in 2026
AI Data Analysis Qualitative Data Analysis

Which Qualitative Data Analysis Software Is Easiest to Learn in 2026?

Choosing qualitative data analysis software can become surprisingly complicated. A student analyzing ten interviews does not
August 7, 2026October 6, 2026
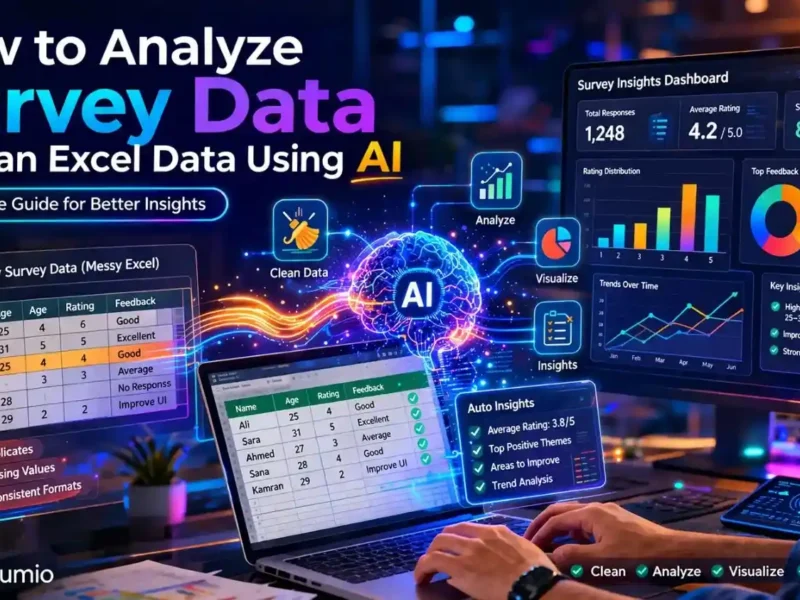
Cinematic AI analyzing survey data and cleaning Excel spreadsheet transforming into insights
AI Data Analysis Data Cleaning

How to Analyze Survey Data and Clean Excel Data Using AI (Complete Guide)

Learn how to analyze survey data and clean Excel data efficiently. This guide shows step-by-step methods and how AI tools automate insights.

August 5, 2026August 5, 2026

Contact Us

Info@DataLumio.Co

Level 1, Devonshire House, One Mayfair Place, London, United Kingdom

About This Site

Transform the way you handle research. From qualitative insights to quantitative reports, DataLumio automates analysis and delivers clear, comprehensive results with charts, tables, and interpretations — helping you save time, enhance accuracy, and focus on what matters most: making informed, data-driven decisions.

Recent Posts

  • How to Analyze Qualitative Data Using AI: A Step-by-Step Guide (2026)
  • How to Analyze Quantitative Data: A Step-by-Step Guide for Researchers
  • Best Data Visualization Software in 2026: 10 Tools Compared for Dashboards, Analysis, and No-Code Use
  • X
  • Facebook
  • LinkedIn
Copyright 2026 | DataLumio Blog
Proudly powered by WordPress | Theme: Palawan by Candid Themes.