Skip to content

DataLumio Blogs

Engaging readers across the globe, from students and researchers to enthusiasts and professionals.

  • X
  • Facebook
  • LinkedIn
  • Home
  • Explore More
  • Privacy Policy

Category: Data Visualization

  • Home
  • Data Visualization
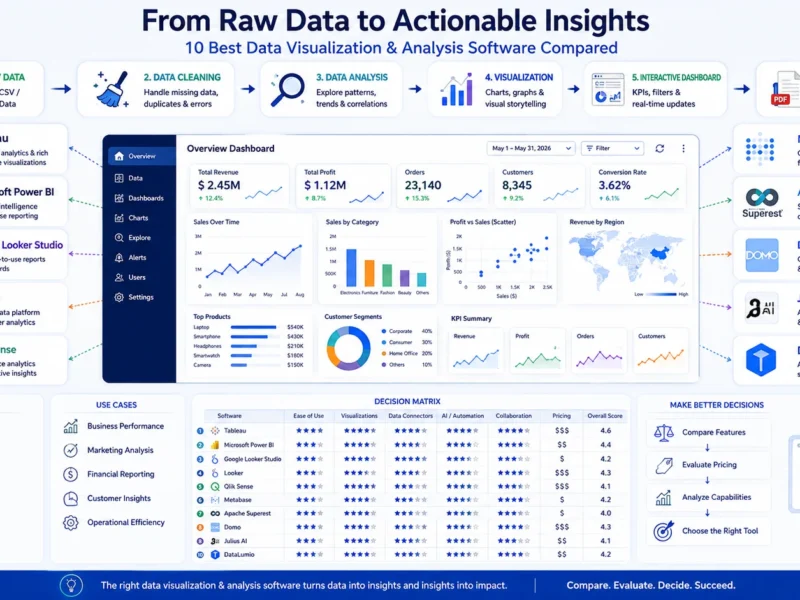
Comparison of data visualization software showing datasets transformed into charts, dashboards, analysis, and reports.
Data Visualization

Best Data Visualization Software in 2026: 10 Tools Compared for Dashboards, Analysis, and No-Code Use

Choosing data visualization software is not really about finding the tool with the most

August 18, 2026August 18, 2026
Contact Us

Info@DataLumio.Co

Level 1, Devonshire House, One Mayfair Place, London, United Kingdom

About This Site

Transform the way you handle research. From qualitative insights to quantitative reports, DataLumio automates analysis and delivers clear, comprehensive results with charts, tables, and interpretations — helping you save time, enhance accuracy, and focus on what matters most: making informed, data-driven decisions.

Recent Posts

  • Best Data Visualization Software in 2026: 10 Tools Compared for Dashboards, Analysis, and No-Code Use
  • Best Qualitative Data Analysis Software in 2026: 07 QDA Tools Compared for Coding, Interviews, Thematic Analysis, and Free Use
  • How to Analyze Survey Data and Clean Excel Data Using AI (Complete Guide)
  • X
  • Facebook
  • LinkedIn
Copyright 2026 | DataLumio Blog
Proudly powered by WordPress | Theme: Palawan by Candid Themes.

Table of Contents

×
  • Best Data Visualization Software at a Glance
  • What Is Data Visualization Software?
  • What Makes Good Data Visualization Software?
    • 1. Ease of use
    • 2. Data compatibility
    • 3. Visualization quality
    • 4. Interactivity
    • 5. Analytical capability
    • 6. Data preparation
    • 7. Dashboard capabilities
    • 8. Collaboration and sharing
    • 9. Governance and security
    • 10. Total complexity
  • The 10 Best Data Visualization Software Tools in 2026
  • 1. Tableau — Best for Advanced Visual Analytics
    • Why consider Tableau?
    • Strengths
    • Potential limitations
  • 2. Microsoft Power BI — Best for Microsoft-Centric Business Intelligence
    • Why consider Power BI?
    • Strengths
    • Potential limitations
  • 3. Google Looker Studio — Best for Accessible Cloud Reporting
    • Strengths
    • Potential limitations
  • 4. Looker — Best for Governed Analytics and Semantic Modeling
    • Strengths
    • Potential limitations
  • 5. Qlik Sense — Best for Interactive Data Exploration
    • Why Qlik is different
    • Strengths
    • Potential limitations
  • 6. Metabase — Best for Accessible Self-Service Analytics
    • Why consider Metabase?
    • Strengths
    • Potential limitation
  • 7. Apache Superset — Best Open-Source Option for Data Exploration
    • Strengths
    • Potential limitations
  • 8. Domo — Best for Integrated Enterprise Data and Dashboards
    • Why consider Domo?
    • Strengths
    • Potential limitations
  • 9. Julius — Best for Conversational Data Analysis and Visualization
    • Why consider Julius?
    • Strengths
    • Potential limitations
  • 10. DataLumio — Best for No-Code Data Analysis and Visualization in One Workflow
    • Why consider DataLumio?
    • Strengths
    • Potential limitations
  • Which Data Visualization Software Is Best for Different Users?
  • Which Data Visualization Software Is Easiest to Learn?
  • What Is the Best Free Data Visualization Software?
  • Which Tools Work Best With Excel and CSV Files?
  • Which Tools Are Best for Dashboards?
    • Enterprise dashboards
    • Self-service dashboards
    • File-to-dashboard workflows
  • Which Data Visualization Software Is Best for Researchers?
  • Data Visualization Software vs. Business Intelligence Software
  • Tableau vs. Power BI: Which Is Better?
    • Choose Tableau when:
    • Choose Power BI when:
  • When Should You Use an AI-Assisted Data Visualization Tool?
  • How to Choose the Best Data Visualization Software
  • Step 1: Identify your starting data
  • Step 2: Identify your actual analytical task
  • Step 3: Determine your technical level
    • Beginner
    • Intermediate
    • Advanced
  • Step 4: Decide whether you need analysis or visualization only
  • Step 5: Consider scale and governance
  • Step 6: Test with your own representative dataset
  • A Practical Decision Tree
    • I mainly need enterprise BI.
    • I need advanced visual analytics.
    • I need Microsoft-oriented business reporting.
    • I need governed analytics and semantic modeling.
    • I want accessible self-service database analytics.
    • I want an open-source visualization platform.
    • I want conversational data analysis.
    • I mainly work with research or spreadsheet files and want cleaning + analysis + dashboards + reporting in one workflow.
  • Common Mistakes When Choosing Visualization Software
    • Choosing the most powerful tool instead of the most suitable one
    • Comparing only chart counts
    • Ignoring data preparation
    • Forgetting the audience
    • Ignoring maintenance
    • Choosing based only on price
    • Trusting automated analysis without validation
  • What Are the Limitations of Data Visualization Software?
  • What Should You Check Before Buying Data Visualization Software?
    • Data compatibility
    • Analysis
    • Visualization
    • Workflow
    • Usability
    • Governance
    • Cost
  • Which Data Visualization Tool Should You Choose?
  • Frequently Asked Questions
    • What is the best data visualization software in 2026?
    • What is the easiest data visualization software?
    • What is the best free data visualization software?
    • Which data visualization tools work with Excel?
    • Which data visualization tools work with CSV?
    • Do data visualization tools require coding?
    • Can data visualization software analyze data too?
    • Is data visualization the same as business intelligence?
    • What should researchers look for in data visualization software?
  • Conclusion: Choose the Tool That Fits the Workflow
    • A practical next step
    • Related Resources
→ Table of Contents