Skip to content

DataLumio Blogs

Engaging readers across the globe, from students and researchers to enthusiasts and professionals.

  • X
  • Facebook
  • LinkedIn
  • Home
  • Explore More
  • Privacy Policy

Category: Quantitative Data Analysis

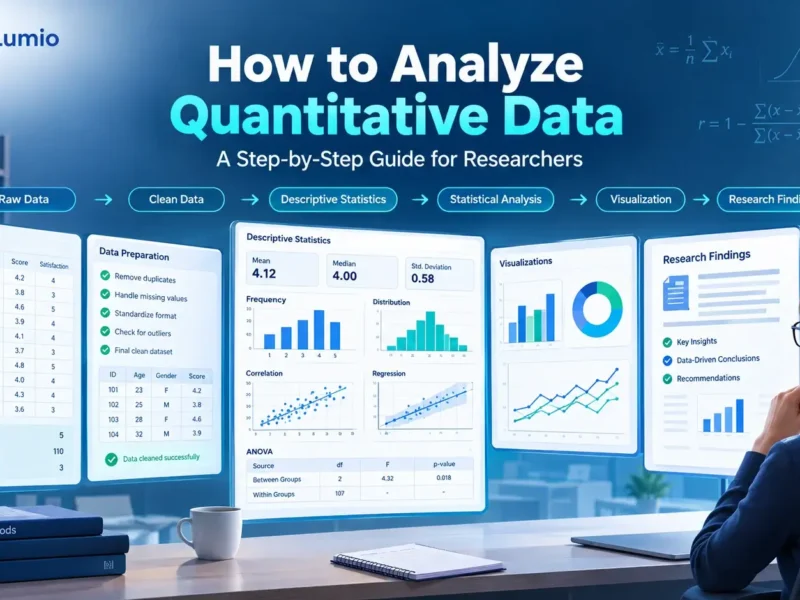
Quantitative data analysis workflow showing statistical methods, charts, and research findings
Quantitative Data Analysis

How to Analyze Quantitative Data: A Step-by-Step Guide for Researchers

Quantitative research produces data in the form of numbers: survey ratings, test scores, income,

September 9, 2026September 9, 2026
Contact Us

Info@DataLumio.Co

Level 1, Devonshire House, One Mayfair Place, London, United Kingdom

About This Site

Transform the way you handle research. From qualitative insights to quantitative reports, DataLumio automates analysis and delivers clear, comprehensive results with charts, tables, and interpretations — helping you save time, enhance accuracy, and focus on what matters most: making informed, data-driven decisions.

Recent Posts

  • How to Analyze Qualitative Data Using AI: A Step-by-Step Guide (2026)
  • How to Analyze Quantitative Data: A Step-by-Step Guide for Researchers
  • Best Data Visualization Software in 2026: 10 Tools Compared for Dashboards, Analysis, and No-Code Use
  • X
  • Facebook
  • LinkedIn
Copyright 2026 | DataLumio Blog
Proudly powered by WordPress | Theme: Palawan by Candid Themes.

Table of Contents

×
  • What Is Quantitative Data Analysis?
    • What Is Quantitative Data?
  • Examples of Quantitative Data
    • Education
    • Business
    • Healthcare
    • Social Sciences
    • Experimental Research
  • Quantitative Data vs. Qualitative Data
  • How Do You Analyze Quantitative Data?
  • Step 1: Start With Your Research Question and Hypotheses
    • Identify Your Variables
    • Define Your Hypotheses
  • Step 2: Understand Your Variables and Data Types
    • Categorical Variables
    • Numerical Variables
    • Ordinal Variables
    • Measurement Scales
  • Step 3: Prepare and Clean Your Quantitative Data
    • Check for Missing Data
    • Check for Duplicate Records
    • Check Data Types
    • Identify Outliers
  • Step 4: Explore the Dataset Before Statistical Testing
  • Step 5: Perform Descriptive Quantitative Data Analysis
    • Mean
    • Median
    • Mode
    • Range
    • Variance
    • Standard Deviation
    • Frequencies and Percentages
  • Step 6: Choose the Right Quantitative Data Analysis Method
    • Descriptive Analysis
    • Example
    • Comparative Analysis
      • Independent-Samples t-Test
      • Paired-Samples t-Test
      • ANOVA
  • Correlation Analysis
  • Regression Analysis
  • Chi-Square Analysis
  • Nonparametric Quantitative Analysis Methods
  • Types of Quantitative Analysis
    • Descriptive Quantitative Analysis
    • Inferential Quantitative Analysis
    • Comparative Analysis
    • Correlational Analysis
    • Predictive Analysis
    • Exploratory Analysis
  • Step 7: Check Statistical Assumptions
    • Normality
    • Independence
    • Homogeneity of Variance
    • Linearity
    • Multicollinearity
    • Sample Size
  • Step 8: Perform Inferential Data Analysis
    • What Is a P-Value?
    • Confidence Intervals
    • Statistical vs. Practical Significance
  • Quantitative Data Analysis Methods: Which Method Should You Use?
  • Quantitative Analysis Examples
    • Example 1: Student Survey Data
    • Example 2: Comparing Two Teaching Methods
    • Example 3: Comparing Three Departments
    • Example 4: Examining Categorical Associations
    • Example 5: Predicting Exam Performance
  • Step 9: Visualize Quantitative Data
    • Bar Charts
    • Histograms
    • Box Plots
    • Scatter Plots
    • Line Charts
  • Step 10: Interpret Quantitative Research Results
  • Step 11: Report Quantitative Data Analysis in a Research Paper
    • Methods Section
    • Results Section
    • Avoid Reporting Numbers Without Context
  • How to Analyze Quantitative Data With DataLumio
    • Upload Your Dataset
    • Describe Your Research Question
    • Review the Dataset
    • Run the Quantitative Analysis
    • Review the Results
    • Use the Results in Your Research Workflow
  • Common Mistakes When Analyzing Quantitative Data
    • Choosing a Statistical Test Before Defining the Research Question
    • Ignoring Missing Data
    • Automatically Deleting Outliers
    • Ignoring Statistical Assumptions
    • Using the Mean for Every Dataset
    • Treating P-Values as the Whole Result
    • Confusing Correlation With Causation
    • Running Too Many Tests Without a Clear Plan
    • Reporting Software Output Without Interpretation
  • Best Practices for Quantitative Data Analysis
  • Quantitative Data Analysis Tools and Software
    • Excel
    • SPSS
    • R
    • Python
    • Jamovi
    • DataLumio
  • Frequently Asked Questions About Quantitative Data Analysis
    • What is quantitative data analysis?
    • How do you analyze quantitative data?
    • What are the main quantitative data analysis methods?
    • What are the types of quantitative analysis?
    • What are examples of quantitative data?
    • What are examples of quantitative analysis?
    • How do you choose a quantitative analysis method?
    • What is the difference between descriptive and inferential analysis?
    • Can quantitative analysis prove causation?
    • What software can be used for quantitative data analysis?
    • Can students use DataLumio for quantitative research?
  • Final Checklist: How to Analyze Quantitative Data
    • Resources:
→ Table of Contents