Choosing an AI analytics platform sounds easy until every product promises instant insights, automatic dashboards, and effortless reporting. Pick the wrong one, and you may end up with attractive charts that do not answer your real business questions.
This guide compares the best AI tools for data analysis in 2026 based on their workflow, supported data, ease of use, reporting capabilities, limitations, and ideal users.
Reviewed and updated: July 17, 2026
Transparency note: DataLumio is our platform. To make this comparison useful, we reviewed competing products using their current public documentation and clearly identified the situations where another tool may be the stronger choice.
Quick Answer: What Is the Best AI for Data Analysis?
The best AI for data analysis depends on what you need to accomplish:
- DataLumio is our top choice for no-code qualitative and quantitative analysis in one workspace.
- Julius AI is best for asking conversational questions about spreadsheets and connected data.
- ChatGPT is best for flexible, code-backed analysis and custom calculations.
- Power BI Copilot is best for companies already using Microsoft Fabric and Power BI.
- Tableau Agent is best for advanced visual exploration and data storytelling.
- ThoughtSpot is best for natural-language questions over governed business data.
- Looker with Gemini is best for Google Cloud teams using a defined semantic model.
- Domo.AI is best for end-to-end enterprise data operations.
- PolymerSearch is best for quickly creating no-code dashboards and embedded analytics.
- Qlik Sense is best for augmented analytics, predictive analysis, and complex data exploration.
There is no universal winner. A researcher analyzing interviews and survey results has different needs from a multinational company managing governed dashboards across several departments.
How We Compared These AI Data Analysis Tools
We evaluated each platform across seven practical areas:
- Input flexibility: Can it analyze spreadsheets, databases, documents, surveys, PDFs, or transcripts?
- Data preparation: Can it identify missing values, duplicate records, formatting problems, and inconsistent fields?
- Analysis depth: Does it support descriptive, diagnostic, statistical, predictive, or qualitative analysis?
- Visualization: Can it produce useful charts, dashboards, summaries, and reports?
- Ease of use: Can a non-technical person get useful results without Python, SQL, or complex formulas?
- Repeatability: Can teams refresh an analysis, reuse a workflow, and share results?
- Governance: Does it support permissions, semantic models, security controls, and organizational data standards?
The rankings reflect overall workflow fit. They are not based only on the number of features a product advertises.
AI Tools for Data Analysis: Comparison Table
| Tool | Best For | Ease of Use | Data Cleaning | Dashboards and Reports | PDF or Qualitative Analysis |
|---|---|---|---|---|---|
| DataLumio | Mixed-method, no-code analysis | High | Strong | Generated dashboards and reports | Strong |
| Julius AI | Conversational spreadsheet analysis | High | Moderate | Charts, summaries and notebooks | Limited |
| ChatGPT | Flexible code-backed analysis | Medium–High | Strong | Charts and downloadable outputs | Good |
| Power BI Copilot | Microsoft enterprise BI | Medium | Strong with setup | Advanced | Not a primary use |
| Tableau Agent | Visual exploration | Medium | Moderate | Advanced | Not a primary use |
| ThoughtSpot | Governed natural-language analytics | Medium | Depends on data model | Advanced | Limited |
| Looker with Gemini | Google Cloud semantic analytics | Medium after setup | Depends on data model | Advanced | Limited |
| Domo.AI | Enterprise data and AI operations | Medium | Strong | Advanced | Limited |
| PolymerSearch | Fast no-code dashboards | High | Basic–Moderate | Strong | Limited |
| Qlik Sense | Augmented and predictive analytics | Medium | Strong | Advanced | Limited |
1. DataLumio: Best Overall for No-Code Mixed-Method Analysis
Best for
Researchers, small businesses, consultants, students, analysts, and teams that need to work with both structured data and documents.
Why DataLumio ranks first
Most AI data analysis tools focus on one side of the workflow. They may analyze spreadsheets, create dashboards, or answer questions about documents. DataLumio brings these tasks into one no-code workspace.
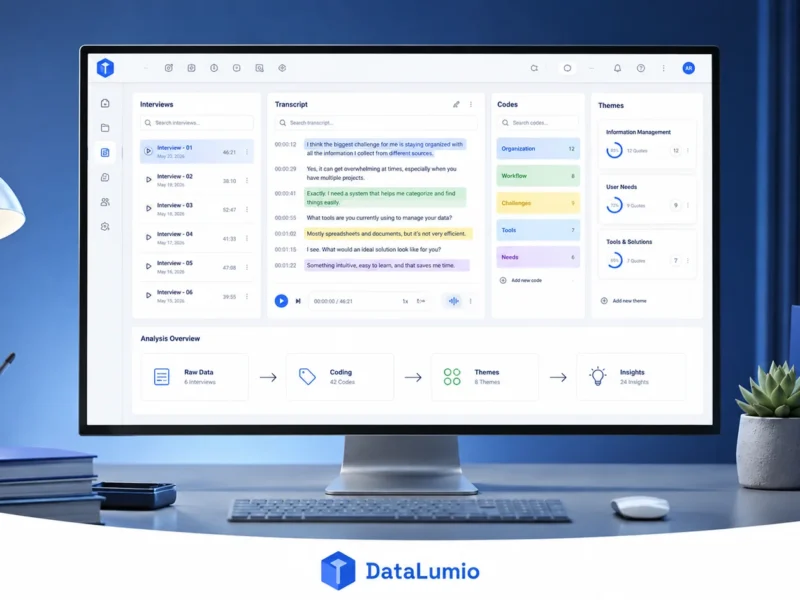
Users can upload spreadsheets, CSV files, PDFs, survey files, transcripts, research documents, and business datasets. The platform supports data cleaning, quantitative analysis, qualitative analysis, interactive dashboards, PDF conversations, and structured report generat
This makes it especially useful when a project contains more than numbers. For example, a customer research project may include:
- Survey ratings
- Written feedback
- Interview transcripts
- Customer profile data
- Existing PDF reports
Instead of moving between a spreadsheet cleaner, a coding notebook, a PDF chatbot, and a dashboard tool, users can manage more of the workflow from one platform.
Key capabilities
- Excel and CSV analysis
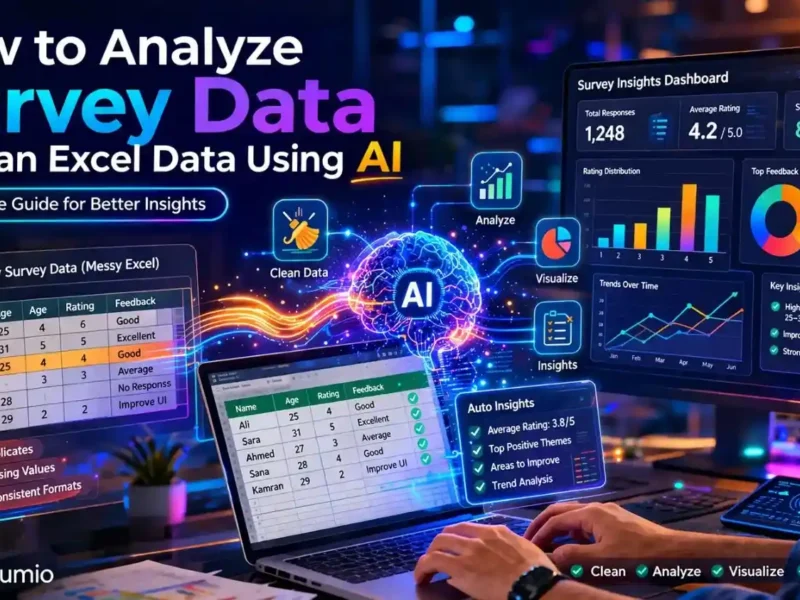
- Duplicate, empty-row and missing-value checks
- Quantitative analysis
- Qualitative coding and theme identification
- Sentiment and text analysis
- PDF chat with a side-by-side document viewer
- AI-generated dashboards
- Charts, tables and written interpretations
- Structured research and business reports
- No Python, SQL or formula writing required
Main limitations
DataLumio is not designed to replace every specialist analytics platform. Large enterprises that need complex semantic layers, extensive data engineering, advanced permission models, or highly customized BI deployments may be better served by Power BI, Looker, Qlik, or Domo.
It is also a newer product with a smaller integration and training ecosystem than established enterprise platforms.
Who should choose DataLumio?
Choose DataLumio when you want to upload data, clean it, analyze it, visualize the findings, and produce a readable report without building a technical analytics environment.
It is a strong fit for:
- Survey and market research
- Academic research
- Customer feedback analysis
- Small-business reporting
- Financial spreadsheet reviews
- Operational performance analysis
- Mixed qualitative and quantitative projects
2. Julius AI: Best for Conversational Spreadsheet Analysis
Best for
People who want to ask questions about spreadsheets, databases, or connected data in natural language.
Julius provides a chat-based way to explore data. Users can upload files or connect databases, warehouses, and spreadsheets, then request calculations, visualizations, summaries, and follow-up analysis.
Its documentation also highlights shared workspaces, notebooks, a data explorer, direct data connectors, and a Slack agent for asking questions from workplace conversati
Where Julius performs well
Julius works well for exploratory questions such as:
- Which product category had the highest growth?
- What caused the fall in conversion rate?
- Are sales significantly different across regions?
- Create a chart showing monthly customer churn.
- Identify unusual values in this dataset.
The conversational interface makes it approachable for users who know what they want to learn but do not know which formula, SQL query, or statistical test to use.
Main limitations
Julius remains strongly centered on conversational analysis. Businesses that need a tightly structured workflow covering document review, qualitative coding, repeatable executive reports, and formal dashboard distribution may need other products.
Usage allowances and access to advanced capabilities can also vary by plan.
Who should choose Julius?
Choose Julius when your main goal is to converse with spreadsheets or connected data and quickly generate calculations, charts, and explanations.
3. ChatGPT: Best for Flexible, Code-Backed Data Analysis
Best for
Analysts, marketers, researchers, developers, and advanced users who need flexible calculations or custom analysis.
ChatGPT can inspect uploaded data, answer questions, clean datasets, create tables, generate charts, and run code in a secure analysis environment. It can also work with CSV files, spreadsheets, PDFs, presentations, and other supported docume
Its main advantage is flexibility. A user can ask ChatGPT to:
- Inspect column types and missing values
- Standardize dates and categories
- Create calculated fields
- Run statistical tests
- Build forecasting models
- Produce Python code
- Explain the methodology
- Generate several chart types
- Export cleaned or transformed files
OpenAI recommends using clear column names, one record per row, and specific instructions about calculations, groupings, columns, or chart ty
Where ChatGPT performs well
ChatGPT is particularly useful when an analysis does not fit a fixed dashboard template. It can combine coding, reasoning, writing, and visual analysis in one conversation.
For example, a marketing analyst could upload campaign data and request:
- Data-quality checks
- Cost-per-lead calculations
- Channel comparisons
- Anomaly detection
- A chart pack
- A written performance summary
Main limitations
ChatGPT is not a dedicated business intelligence system. It does not automatically provide the persistent semantic models, company-wide metric definitions, scheduled dashboard distribution, and governance found in enterprise BI platforms.
The quality of the output also depends on the prompt, dataset structure, and verification process. Users should check formulas, assumptions, totals, filters, and statistical conclusions before making important decisions.
Who should choose ChatGPT?
Choose ChatGPT when you need flexible analysis, custom code, unusual calculations, or an assistant that can explain and document its work.
4. Microsoft Power BI Copilot: Best for Microsoft-Centered Enterprise BI
Best for
Organizations already using Microsoft Fabric, Power BI, Azure, Excel, Teams, or other Microsoft services.
Power BI is no longer simply a manual dashboard tool with a few AI features. Copilot can answer natural-language questions, summarize reports, create and analyze visuals, help build report pages, generate DAX, and assist with semantic-model descripti
Microsoft also provides standalone, report-level, and app-level Copilot experiences, although some capabilities remain in preview or have specific capacity requirements.
Where Power BI performs well
Power BI is a strong choice for:
- Executive dashboards
- Departmental KPI reporting
- Financial reporting
- Sales and operational analytics
- Controlled access to business data
- Microsoft Fabric data environments
- Scheduled and shared reporting
Its greatest advantage is not one-off file analysis. It is the ability to create an organization-wide reporting system with shared definitions, data models, access controls, refresh schedules, and interactive reports.
Main limitations
Power BI requires more preparation than lightweight AI tools. Microsoft states that model owners must prepare semantic models so Copilot understands business context and returns consistent answers. Poor preparation can produce generic, inaccurate, or misleading out
Copilot also requires eligible paid Fabric or Power BI Premium capacity. A standard individual license may not be enough.
Who should choose Power BI?
Choose Power BI when your company already works in the Microsoft ecosystem and needs governed, repeatable dashboards rather than occasional spreadsheet analysis.
5. Tableau Agent: Best for AI-Assisted Data Visualization
Best for
Analysts and organizations that place visual exploration and data storytelling at the center of their workflow.
Tableau Agent allows users to explore data through a conversational assistant. It can suggest analytical questions, create visualizations, select chart types, perform time-series analysis, create calculated fields, explain calculations, and apply filters or sort
Supported visualization types include bar charts, lines, heatmaps, scatter plots, histograms, maps, treemaps, box plots, Gantt charts, bubble charts, and other common formats.
Where Tableau performs well
Tableau remains one of the strongest options when the final output must be an interactive, polished visual experience.
It works well for:
- Executive presentations
- Public or customer-facing dashboards
- Geographic analysis
- Complex visual exploration
- Data storytelling
- Departmental analytics
Main limitations
Tableau Agent is not a general-purpose AI assistant. It works within the Tableau analysis environment and focuses on questions related to the connected data.
The current experience also has contextual limits. For example, conversations may be tied to individual worksheets, and users need to provide specific terminology and analytical instructions. Access to Tableau Agent may require Tableau+ or an eligible tr
Who should choose Tableau?
Choose Tableau when visual exploration, dashboard design, and presentation quality matter more than document analysis or a simple upload-and-report workflow.
6. ThoughtSpot: Best for Governed Natural-Language Analytics
Best for
Business teams that want to ask plain-language questions about live, governed company data.
ThoughtSpot focuses on search-driven and conversational business intelligence. Users can ask questions in natural language, explore metrics, drill into performance changes, and receive answers grounded in verified business definiti
Its Spotter agents can support analytical tasks, data modeling, visualization, and coding. ThoughtSpot also emphasizes its semantic layer, which helps translate business language into consistent dimensions, measures, and relationsh
Where ThoughtSpot performs well
ThoughtSpot is useful when business users regularly ask questions such as:
- Why did revenue decline last week?
- Which customers are most likely to churn?
- Which region missed its target?
- What changed after the new pricing plan?
- Which products contributed most to margin growth?
Rather than waiting for an analyst to build a new dashboard for each question, users can explore approved business data conversationally.
Main limitations
ThoughtSpot is more suited to connected business data than one-off PDF, transcript, or spreadsheet projects. It also requires careful setup of data models, definitions, permissions, and organizational context.
Who should choose ThoughtSpot?
Choose ThoughtSpot when you need self-service questions over live enterprise data while maintaining shared definitions and governance.
7. Looker with Gemini: Best for Governed Google Cloud Analytics
Best for
Organizations using Google Cloud, BigQuery, LookML, and centralized metric definitions.
Looker’s Conversational Analytics uses Gemini to interpret natural-language questions. It grounds responses in the Looker semantic model, where business definitions, dimensions, measures, joins, permissions, and calculations are already defi
The platform can return data answers and visualizations. Its advanced analytics capability can also translate a natural-language request into Python code for more complex analy
Where Looker performs well
Looker is a strong option for:
- BigQuery-based data environments
- Governed self-service analytics
- Centralized metric definitions
- Embedded analytics
- Data products
- Large organizations with analytics engineering teams
A semantic layer can reduce disputes about what terms such as revenue, active customer, churn, or conversion actually mean.
Main limitations
Looker requires more technical preparation than a file-upload tool. Teams may need LookML expertise, data modeling, administration, and careful configuration before conversational analytics works reliably.
Google also warns that Gemini can generate plausible but incorrect output and recommends validating results before
Who should choose Looker?
Choose Looker when your organization uses Google Cloud and needs natural-language analytics built on controlled, reusable business definitions.
8. Domo.AI: Best for End-to-End Enterprise Data Operations
Best for
Enterprises that want data integration, dashboards, AI agents, analytics, and operational workflows in one platform.
Domo combines data management, analytics, visualization, conversational AI, and AI-agent capabilities. Its AI Chat feature helps users explore data, uncover trends, create visualizations, and receive contextual recommendati
Domo also focuses on preparing and contextualizing organizational data so AI responses have better business meaning.
Where Domo performs well
Domo is suitable for:
- Enterprise data integration
- Real-time business dashboards
- Operational alerts
- Company-wide reporting
- AI-enabled business applications
- Embedded analytics
- Workflow automation
Main limitations
Domo may offer more functionality than a small team needs. A business that only wants to analyze occasional spreadsheets could face unnecessary complexity compared with DataLumio, Julius, ChatGPT, or PolymerSearch.
Who should choose Domo?
Choose Domo when analytics is part of a broader enterprise data strategy and your organization wants one platform for integration, intelligence, applications, and action.
9. PolymerSearch: Best for Fast No-Code Dashboards
Best for
Startups, agencies, ecommerce teams, marketers, and software companies that need dashboards without a lengthy BI setup.
PolymerSearch focuses on AI-generated dashboards and embedded analytics. Users can connect data and allow the platform to suggest visualizations, create dashboards, explain findings, and answer questions conversationa
Where PolymerSearch performs well
PolymerSearch can help users quickly turn spreadsheet or connected data into:
- Marketing dashboards
- Ecommerce reports
- Sales dashboards
- Client-facing reports
- Embedded charts
- Product analytics interfaces
Its no-code approach is useful for teams that care more about fast visualization than custom statistical programming.
Main limitations
PolymerSearch may not match the advanced modeling, governance, permissions, and data-engineering depth of Power BI, Tableau, Looker, Domo, or Qlik.
It is also less suitable for qualitative research, transcript coding, or detailed PDF analysis.
Who should choose PolymerSearch?
Choose PolymerSearch when you need attractive dashboards or embedded analytics quickly and do not want to build a traditional BI environment.
10. Qlik Sense: Best for Augmented and Predictive Analytics
Best for
Organizations that need interactive exploration, AI-assisted preparation, predictive analysis, dashboards, and enterprise analytics.
Qlik Sense combines dashboards with augmented analytics features such as automated insight generation, natural-language interaction, AI-assisted data preparation, AutoML, and predictive analyt
Its natural-language capabilities can answer factual questions, comparisons, rankings, and time-based queries over prepared data mod
Where Qlik performs well
Qlik is a strong choice for:
- Complex data relationships
- Enterprise dashboards
- Supply-chain analysis
- Financial and operational reporting
- Predictive modeling
- Self-service business intelligence
- Multi-source data exploration
Main limitations
Qlik’s broad capabilities create a steeper learning curve than lightweight AI analysis products. Organizations may require trained users, administrators, proper data models, and an implementation plan.
Who should choose Qlik?
Choose Qlik when your organization needs a mature analytics platform with natural-language exploration, predictive capabilities, and broad enterprise functionality.
Which AI Data Analysis Tool Should You Choose?
Use the following decision guide to narrow your options.
Choose DataLumio when:
- You work with spreadsheets, surveys, PDFs, transcripts, or research files.
- You want qualitative and quantitative analysis in one place.
- You need data cleaning, dashboards, and written reports.
- You do not want to write code.
Choose Julius AI when:
- You mainly analyze spreadsheets or connected datasets.
- You prefer a conversational workflow.
- You want fast charts and answers to follow-up questions.
Choose ChatGPT when:
- You need custom calculations or Python-based analysis.
- Your workflow changes from project to project.
- You want the AI to explain its code and methodology.
- You are comfortable checking the output carefully.
Choose Power BI Copilot when:
- Your company already uses Microsoft Fabric or Power BI.
- You need governed dashboards and scheduled reporting.
- Several departments need controlled access to shared metrics.
Choose Tableau Agent when:
- Visualization and data storytelling are top priorities.
- Your users already know Tableau.
- You need interactive, presentation-quality dashboards.
Choose ThoughtSpot when:
- Business users need to question live company data.
- Your organization already has governed definitions and models.
- You want conversational self-service analytics.
Choose Looker with Gemini when:
- Your data stack runs on Google Cloud or BigQuery.
- Your team uses LookML.
- Consistent metric definitions and embedded analytics matter.
Choose Domo.AI when:
- You want enterprise data integration and analytics together.
- You need dashboards, AI agents, alerts, and workflows.
- Analytics must connect directly to business operations.
Choose PolymerSearch when:
- You need a dashboard quickly.
- You want to embed analytics in a website or application.
- Your team wants a no-code visualization workflow.
Choose Qlik Sense when:
- You have complex data sources and analytical relationships.
- You need predictive analysis and AutoML.
- Your organization wants a mature enterprise analytics platform.
How to Test an AI Data Analysis Tool Before Paying
Do not choose a platform from a polished product demonstration alone. Test each shortlisted tool with the same real-world dataset.
A useful trial process should include the following tasks:
1. Upload a messy file
Use a spreadsheet containing:
- Missing values
- Duplicate records
- Incorrect date formats
- Inconsistent categories
- Blank columns
- Outliers
Check whether the tool identifies the issues and explains any changes it makes.
2. Ask a simple factual question
For example:
What was total revenue during the second quarter?
Verify the answer manually.
3. Ask a diagnostic question
For example:
Why did revenue decline in June?
Check whether the tool separates evidence from assumptions.
4. Request a visualization
Ask it to select the most appropriate chart and explain why that chart fits the question.
5. Correct the AI
Tell the tool that a metric uses a different definition. See whether it applies the correction consistently during follow-up analysis.
6. Export the result
Check whether you can download:
- Cleaned data
- Charts
- Dashboards
- Tables
- Written reports
- Code or formulas
7. Review privacy and security
Before uploading sensitive customer, employee, financial, medical, or research information, check:
- Data-retention rules
- Model-training policies
- Encryption
- User permissions
- Compliance documentation
- Data-location requirements
- Account deletion and file-removal controls
Common Mistakes When Using AI for Data Analysis
Trusting the first answer
AI can produce a confident explanation even when it misunderstands a column, filter, date range, or business definition. Reconcile important totals with the source file.
Ignoring data preparation
AI does not make poor-quality data reliable. Microsoft specifically notes that unprepared semantic models can lead to inaccurate or misleading Copilot respon
Using vague prompts
“Analyze this data” gives the tool too much freedom. Ask a clear question and name the required metric, date range, segments, calculations, and output format.
Confusing charts with insights
A chart shows a pattern. It does not automatically explain what caused that pattern. Ask the tool to separate observations, possible explanations, and verified conclusions.
Choosing a tool that is too complex
A small business analyzing one monthly spreadsheet may not need an enterprise BI platform. Extra features can increase cost, training time, and implementation work.
Choosing a tool that is too simple
A conversational file analyzer may not be enough when hundreds of employees need governed access to live operational data.
Uploading confidential information without review
Never assume every AI platform handles data in the same way. Check the provider’s current privacy, security, retention, and model-training policies.
Can AI Replace Data Analysts?
AI can reduce the time spent cleaning files, writing routine queries, creating first-draft charts, and summarizing results. It cannot take full responsibility for business context, data governance, analytical judgment, stakeholder communication, or high-risk decisions.
A skilled analyst still needs to determine:
- Whether the data is suitable
- Which question matters
- Which calculation is valid
- Whether a correlation is meaningful
- Whether the result conflicts with domain knowledge
- How uncertainty should be communicated
- What action the organization should take
The most effective workflow treats AI as an analytical assistant rather than an unquestioned authority.
Frequently Asked Questions
What is the best AI tool for data analysis in 2026?
DataLumio is a strong overall option for no-code analysis involving spreadsheets, surveys, PDFs, transcripts, dashboards, and reports. ChatGPT is better for flexible code-backed analysis, while Power BI, Tableau, Looker, Domo, ThoughtSpot, and Qlik are stronger for different enterprise BI requirements.
What is the best AI for analyzing Excel data?
DataLumio and Julius AI are suitable for straightforward no-code spreadsheet analysis. ChatGPT is useful when you need custom cleaning, formulas, Python calculations, statistical tests, or unusual transformations.
Can AI automatically clean data?
Yes. Several AI tools can help identify missing values, duplicates, formatting problems, inconsistent categories, blank fields, and possible outliers. However, users should review every change because an automated cleaning decision can alter the meaning of the dataset.
Is ChatGPT good for data analysis?
ChatGPT is useful for cleaning structured files, calculating metrics, running code, creating charts, explaining methods, and generating downloadable outputs. It is less suitable as a permanent enterprise dashboard and governance system.
Which AI tool can analyze PDFs and spreadsheets?
DataLumio supports spreadsheets, PDFs, research documents, survey files, transcripts, dashboards, and reports in one no-code workspace. ChatGPT can also work with uploaded spreadsheets and supported documents, although its workflow is less specialized.
Which AI data analysis tool is best for businesses?
Small businesses may prefer DataLumio, Julius AI, ChatGPT, or PolymerSearch because they require less technical setup. Larger organizations may prefer Power BI, Tableau, ThoughtSpot, Looker, Domo, or Qlik for governance, integrations, reusable dashboards, and enterprise-scale deployment.
Are AI-generated data insights accurate?
They can be accurate, but accuracy depends on data quality, metric definitions, platform configuration, prompt clarity, and the type of analysis. Google and Microsoft both advise users to prepare data carefully and validate AI-generated resu
Final Verdict
The best AI tools for data analysis do more than create charts. They help users prepare information, ask better questions, identify patterns, communicate findings, and repeat the process when new data arrives.
For no-code projects that combine spreadsheets, surveys, documents, qualitative information, dashboards, and written reporting, DataLumio offers the most balanced workflow in this comparison.
Choose Julius AI for conversational spreadsheet exploration and ChatGPT for flexible, code-backed work. Select Power BI Copilot, Tableau Agent, ThoughtSpot, Looker with Gemini, Domo.AI, or Qlik Sense when governance, semantic models, live data, and organization-wide reporting matter more than simple file uploads.
For fast no-code dashboard creation or embedded reporting, PolymerSearch remains a practical alternative.
Before committing to any platform, test it with your own messy dataset, confirm its calculations, review its privacy policies, and assess whether the workflow can be repeated by the people who will use it.