
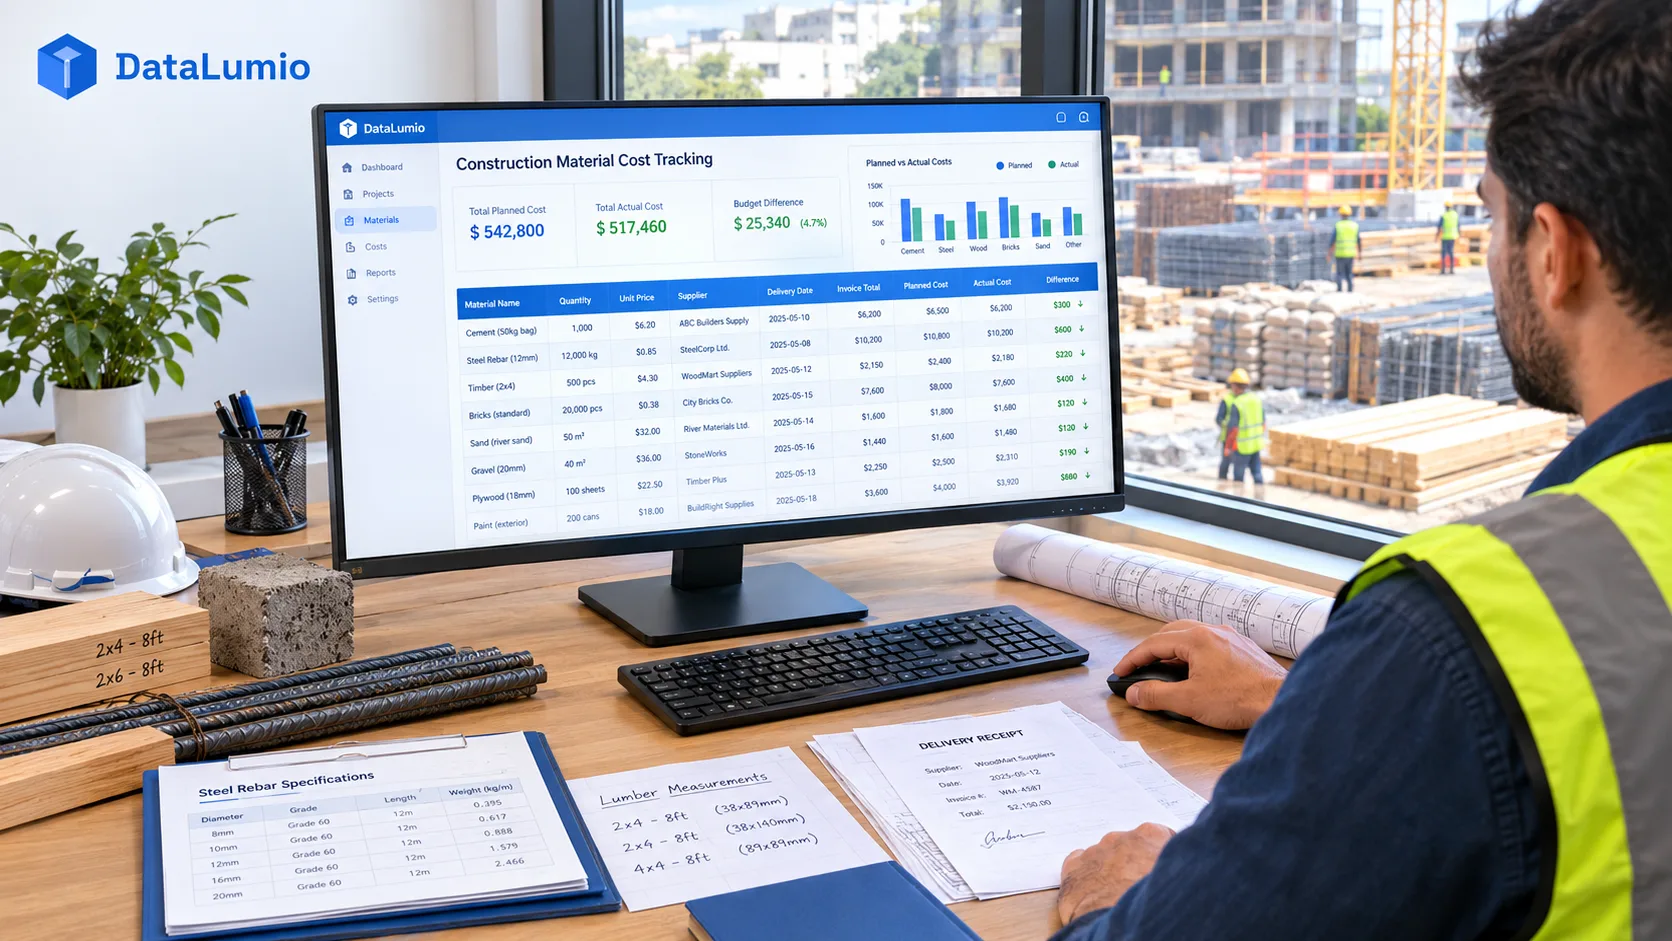
Material costs can change the financial picture of a construction project long before the final invoice arrives. A supplier may revise a quotation, a project may require more material than expected, or a delivery charge may be missing from the original estimate. If purchases are recorded in different files or under inconsistent descriptions, understanding the actual cost becomes unnecessarily difficult.
A construction material cost tracking spreadsheet provides a central place to record quantities, prices, deliveries, and expenses. It does not need to replace accounting software or a formal estimating system. Its purpose is to make material information easier to review and compare.
A useful spreadsheet answers four basic questions: What material was needed? How much was expected? What was ordered and received? How much did it cost?
This guide explains how to build one in Excel, calculate meaningful totals, and use the resulting information to improve purchasing decisions.
1. Decide What the Spreadsheet Needs to Track
Before creating columns, determine how the information will be used.
A small renovation may need a simple list of materials and supplier prices. A larger project may need to track material quantities by building section, floor, work package, or subcontractor.
A practical starting spreadsheet can include:
| Field | Purpose |
|---|---|
| Project ID | Identifies the construction project |
| Work package | Connects the material to a particular activity |
| Material ID | Helps distinguish similar products |
| Material description | Records the specific item or specification |
| Supplier | Identifies the source |
| Estimate quantity | The quantity included in the estimate |
| Ordered quantity | The quantity requested from the supplier |
| Received quantity | The quantity actually delivered |
| Unit | The measurement used for the item |
| Estimated unit price | The original expected price |
| Actual unit price | The recorded purchase price |
| Delivery charge | A separately identifiable transport expense |
| Tax or other charges | Costs that apply under the relevant agreement |
| Invoice reference | Connects the record to supporting documentation |
| Status | Planned, ordered, partially received, or completed |
Not every field needs to appear in the first version. Choose the fields that support the decisions you need to make, then add complexity only when there is a clear reason.
The spreadsheet should also distinguish an estimate from a purchase commitment and an actual receipt. These are different stages of a transaction. A quantity that has been ordered is not necessarily the same as a quantity that has been delivered or used.
2. Create a Consistent Material List
Material descriptions are one of the easiest places for tracking systems to become unreliable.
For example, the entries “crushed stone,” “gravel,” and “aggregate” might refer to related but different products. A supplier may also sell multiple grades or sizes that should not be combined in one record.
Create a consistent naming convention. Where the specification matters, record it explicitly. Depending on the material, that might include grade, size, strength specification, product type, or other purchasing requirements.
Use a unique material ID when practical. This makes it easier to connect the estimate, purchase order, delivery record, and invoice without relying on a description that may change slightly between documents.
Avoid merging records merely because their names look similar. If two materials have different specifications or different pricing units, keep them separate until the project team confirms that they can be compared.
3. Record Quantities With Their Units
Every quantity should have an explicit unit.
Concrete may be ordered in cubic yards or cubic meters. Aggregate may be quoted by weight or volume. Timber might be tracked by piece, linear foot, or another specified unit. Fasteners may be purchased by box but used individually.
A quantity of 10 has little meaning without its unit and material description.
For volume-based materials, make sure the dimensions are appropriate for the shape being measured. A rectangular area can be estimated using:
Volume = Length × Width × Depth
When measurements are in feet, the result is cubic feet. To convert to cubic yards, divide by 27.
For example, a rectangular bed measuring 12 feet long, 8 feet wide, and 0.5 feet deep has a geometric volume of:
12 × 8 × 0.5 = 48 cubic feet
48 ÷ 27 ≈ 1.78 cubic yards
This calculation describes the space, not necessarily the exact amount that should be ordered. Site conditions, compaction, uneven depth, material handling, and supplier practices can affect the final quantity.
If you need to estimate the volume of soil, mulch, gravel, sand, or concrete, the CY Calculator cubic yard calculator can help convert dimensions into cubic-yard estimates. Use the result as an input to the spreadsheet and retain the measurement assumptions alongside it.
Do not mix cubic yards and tons in the same quantity column as if they were equivalent. If a supplier prices material by weight but the estimate begins with volume, the conversion requires an appropriate density or supplier-provided conversion factor.
4. Calculate the Estimated Material Cost
For a material priced by unit, the basic calculation is:
Estimated material cost = Estimated quantity × Estimated unit price
Suppose an estimate includes 50 cubic yards of aggregate at $48 per cubic yard.
50 × $48 = $2,400
Record the estimate quantity and unit price separately so the total can be checked. If the unit price changes, you should be able to update the calculation without manually rewriting the total.
In Excel, a simple row formula might look like this:
=F2*J2
In this example, cell F2 contains the estimated quantity and J2 contains the estimated unit price. Adjust the cell references to match your actual spreadsheet.
The formula should only multiply quantities and prices that use compatible units. Multiplying a volume in cubic yards by a price per ton does not produce a valid material cost unless you first establish the appropriate conversion.
Keep delivery charges and other costs in separate columns where possible. This makes it easier to see whether the material itself or its delivery is driving a change in the total.
5. Track Orders, Deliveries, and Invoices Separately
A reliable spreadsheet should show what was ordered, what arrived, and what was charged.
Imagine a project orders 50 cubic yards of aggregate. The supplier delivers 30 cubic yards on the first delivery and 20 on the second. If the spreadsheet records only the original order, it may not reveal a shortage or an additional delivery.
A separate delivery log can contain:
- Delivery date.
- Purchase order number.
- Material ID.
- Quantity delivered.
- Unit of measurement.
- Delivery ticket number.
- Receiving person or team.
- Any recorded discrepancy.
The invoice should be connected to the corresponding order and delivery records. This helps the team identify quantity differences, price changes, duplicate charges, or missing documentation.
If an invoice covers several materials, record the line items separately. Treating the entire invoice as one material expense makes later analysis much less useful.
For projects with frequent deliveries, one row per delivery or invoice line is usually easier to maintain than continually overwriting the same material row.
6. Compare Estimated and Actual Material Costs
Once purchases are recorded, compare the original estimate with the actual cost.
Cost variance = Actual cost − Estimated cost
If the estimate was $2,400 and the recorded actual cost is $2,520, the variance is $120 above the estimate.
Variance percentage = (Actual cost − Estimated cost) ÷ Estimated cost × 100
In this example, the variance is 5%.
A variance is a signal to investigate, not an explanation by itself. The increase could result from a higher unit price, a greater quantity, a delivery charge, an approved design change, or an error in the original estimate.
Where possible, break the difference into its underlying components. Compare quantity against quantity and price against price before concluding that the supplier or the purchasing process caused the overrun.
The Federal Highway Administration’s cost-estimating guidance discusses the effects of material price volatility and other estimating factors. It is a useful external reference when designing a process for reviewing estimates and changes.
7. Use Excel Formulas to Reduce Manual Work
A spreadsheet should make repeated calculations easier, not introduce new opportunities for mistakes.
Useful formulas include:
Total estimated material cost
=SUM(K2:K100)
Total actual material cost
=SUM(L2:L100)
Remaining quantity to receive
=OrderedQuantity-ReceivedQuantity
Cost variance
=ActualCost-EstimatedCost
These are illustrative formulas; replace the names or cell references with the ones in your workbook.
Microsoft’s SUM function guide explains how Excel adds values across ranges and individual cells.
Use Excel tables when the dataset will grow over time. Tables can help keep formulas and formatting consistent as new rows are added. Data validation lists can also reduce variations in category names and status fields.
Do not assume that a formula is correct simply because it returns a number. Test it with a small example, compare the result with a manual calculation, and check what happens when a field is blank or contains an unexpected value.
8. Include Delivery, Waste, and Other Relevant Costs
Material cost is not always equal to the supplier’s quoted unit price multiplied by the estimated quantity.
Depending on the project, the total may also include delivery, unloading, handling, storage, applicable taxes, and other charges. Record these costs consistently and make sure they are allocated appropriately.
Material waste requires particular care. Some projects include an allowance in the original estimate, but the appropriate allowance depends on the material, design, installation method, and site conditions.
Do not add an arbitrary waste percentage simply because it is common in another project. If an allowance is used, record the reason for it and distinguish the planned allowance from the amount actually consumed or discarded.
For volume-based materials, a calculator can estimate the geometric quantity, but it cannot independently determine the correct purchasing allowance for every job. A cubic yard calculator can help with initial volume calculations, while project specifications and supplier guidance should inform the final order.
Where material waste is important to the project, track unused returns, damaged goods, and discarded material separately. This gives the team more information than a single unexplained adjustment to the ordered quantity.
9. Create a Simple Material Cost Dashboard
A dashboard is useful when it answers questions that arise repeatedly.
Consider showing:
- Total estimated material cost.
- Total actual material cost.
- Difference between estimate and actual.
- Largest material cost categories.
- Materials with the greatest quantity variance.
- Orders awaiting delivery.
- Invoices awaiting review.
- Monthly spending by material category.
A chart comparing estimated and actual costs can quickly identify categories that need attention. A table showing the ten largest variances may be more useful than a complex visualization if the team needs to investigate individual transactions.
Make sure the dashboard states the reporting period and whether it includes ordered, delivered, invoiced, or paid amounts. Those figures represent different views of a project’s financial position.
For a larger dataset, DataLumio’s data analysis platform can support workflows involving spreadsheet cleaning, quantitative analysis, visual summaries, and reports. The source spreadsheet should still remain available for reviewing the underlying transactions.
10. Maintain a Clear Audit Trail
A cost-tracking spreadsheet should make it possible to trace a total back to its supporting records.
Keep invoice numbers, purchase order IDs, delivery tickets, and quotation dates. Record changes to the original estimate rather than replacing it without explanation.
It is useful to preserve at least three separate views:
- Original estimate.
- Current approved budget.
- Actual recorded cost.
These values answer different questions. The original estimate shows what was expected at the start. The current budget reflects approved changes. The actual cost records what has been incurred or invoiced according to the chosen accounting basis.
If a project changes significantly, compare the actual cost against both the original estimate and the revised budget where appropriate.
Restrict editing access when multiple people use the workbook, and keep backups. For formal financial reporting, follow the project’s accounting policies rather than treating an informal spreadsheet as the definitive record.
Common Spreadsheet Mistakes
- Combining different units: Never compare cubic yards with tons without a valid conversion.
- Overwriting original estimates: Keep a record of the original assumptions and approved revisions.
- Recording only invoices: Purchase commitments and physical deliveries may need separate tracking.
- Ignoring duplicate records: The same invoice or delivery should not be counted twice.
- Using inconsistent material descriptions: Similar names do not prove that two products are equivalent.
- Treating a budget variance as a supplier error: Investigate quantity, price, scope, and delivery before assigning a cause.
- Adding arbitrary allowances: Document the basis for waste and contingency assumptions.
Final Thoughts
A construction material cost tracking spreadsheet does not need to be complicated to be useful. It needs consistent units, clear descriptions, traceable records, and calculations that can be checked.
Start with the materials that account for the largest share of project spending. Track what was estimated, ordered, delivered, and invoiced. Compare prices and quantities separately, and investigate significant differences while the supporting records are still easy to find.
Over time, the spreadsheet can become a valuable source of historical information for future estimates and purchasing decisions.
For teams that need to move beyond manual spreadsheet review, DataLumio provides tools for cleaning, analyzing, visualizing, and reporting on supported datasets. Used alongside accurate project records, these workflows can make construction material costs easier to understand and communicate.