
Construction projects rarely run over budget for one simple reason. A project may involve changing material prices, inaccurate quantity estimates, additional labor, equipment expenses, delivery charges, or work that was not included in the original estimate. When these costs are recorded across separate spreadsheets, invoices, and progress reports, it becomes difficult to understand where the money is going.
Excel offers a practical starting point for organizing construction costs and comparing planned expenses with actual spending. You do not need an elaborate financial model to begin. A well-structured spreadsheet, consistent records, and a few useful calculations can reveal patterns that would otherwise remain hidden.
The important part is knowing what to record, how to organize it, and what conclusions the data can reasonably support.
What Does Construction Cost Analysis Involve?
Construction cost analysis is the process of reviewing project expenses to understand how money is allocated, how actual spending compares with estimates, and where costs may be changing.
A project manager might want to know whether concrete costs have increased, whether labor is consuming more of the budget than expected, or whether several small purchases are creating a significant additional expense.
These questions require more than adding up invoices. The information needs to be organized into categories that make comparisons meaningful.
Common construction cost categories include:
- Materials such as concrete, timber, steel, gravel, sand, and soil.
- Labor, including wages, subcontractors, and overtime.
- Equipment purchases, rentals, maintenance, and operating expenses.
- Transportation, delivery, and material handling.
- Permits, inspections, professional services, and other project-specific expenses.
- Contingencies and approved changes to the original scope.
The exact categories depend on the project. A residential renovation, a road project, and a commercial building will not necessarily use the same cost structure.
For larger infrastructure projects, the Federal Highway Administration’s cost-estimating guidance provides useful context on the factors that can affect estimates, including material price volatility, construction conditions, and project contingencies.
Step 1: Collect the Right Project Data
Before building formulas or charts, gather the records that describe the project’s financial position.
Useful documents may include the original estimate, supplier quotations, purchase orders, invoices, payroll records, equipment rental statements, delivery receipts, and approved change orders.
Each record should contain enough information to identify the expense and connect it to the correct project activity.
For example, an invoice that says “building supplies” is less useful for analysis than a record that identifies the supplier, material, quantity, unit price, delivery charge, purchase date, and project phase.
A simple spreadsheet can begin with these columns:
| Column | Information to record |
|---|---|
| Date | When the transaction occurred |
| Project or phase | The job or activity being charged |
| Cost category | Materials, labor, equipment, or another category |
| Description | The item or service purchased |
| Quantity | Units purchased or used |
| Unit | Cubic yards, tons, hours, pieces, or another unit |
| Unit price | Cost per recorded unit |
| Estimated cost | The original planned amount |
| Actual cost | The recorded expense |
| Source | Invoice, purchase order, quotation, or another document |
Not every project needs every column. What matters is using a consistent structure that supports the questions you want to answer.
It is also important to distinguish a committed cost from an incurred cost. A purchase order may represent an obligation to buy materials, while an invoice records a charge for goods or services supplied. Counting both as separate expenses without accounting for their relationship can inflate the apparent cost.
Step 2: Organize the Spreadsheet Before Calculating Anything
A spreadsheet becomes difficult to analyze when the same item is recorded under different names or when quantities use inconsistent units.
For example, one supplier’s invoice may describe an item as “ready-mix concrete,” while another calls it “concrete delivery.” Both could belong to the same material category, but they should not automatically be treated as identical products. Specifications, grades, and project requirements may differ.
Create a controlled list of categories and use it consistently. Where possible, give each project phase, supplier, material, and transaction a unique identifier.
Keep the original records intact. If you correct a spelling error, standardize a category, or convert a unit, document the change rather than silently replacing information that might be needed later.
Check for:
- Duplicate invoices or purchase records.
- Blank descriptions and missing quantities.
- Prices entered as text rather than numbers.
- Dates stored in inconsistent formats.
- Negative values that need an explanation.
- Different units used for the same material.
- Expenses assigned to the wrong project phase.
Data cleaning is not just a cosmetic task. Errors in the source data can make an otherwise correct formula produce a misleading result.
Teams handling multiple spreadsheets can use a dedicated preparation workflow before calculating totals. DataLumio’s data analysis features include tools for cleaning, analyzing, and visualizing supported datasets.
Step 3: Calculate Estimated and Actual Costs
Once the data is consistent, create formulas for the basic calculations.
For an item priced by quantity, the estimated cost can be calculated as:
Estimated cost = Estimated quantity × Estimated unit price
The actual cost of a purchase can be calculated as:
Actual purchase cost = Actual purchased quantity × Actual unit price
Suppose a project estimate includes 40 cubic yards of a material at $55 per cubic yard.
The estimated material cost is:
40 × $55 = $2,200
If the recorded purchase is 42 cubic yards at $58 per cubic yard, the actual purchase cost is:
42 × $58 = $2,436
The difference is $236 above the original estimate.
That difference can be broken down further. Two additional cubic yards account for $110 at the original unit price, while the increase from $55 to $58 across 42 cubic yards accounts for another $126. Together, they explain the $236 increase.
This example assumes the quantities and prices are directly comparable and excludes taxes, delivery charges, waste allowances, and other adjustments. Real project records may require separate calculations for these items.
In Excel, the SUM function can total a range of costs:
=SUM(H2:H100)
Microsoft’s official SUM function documentation explains how to add values from individual cells or ranges.
For a more reliable workbook, keep the formulas consistent and separate the original estimate from later revisions. Otherwise, the spreadsheet may show a comparison against a budget that has already been overwritten.
Step 4: Compare the Budget With Actual Spending
The difference between the planned cost and actual cost is commonly called a cost variance.
A straightforward calculation is:
Cost variance = Actual cost − Estimated cost
Using the previous example:
$2,436 − $2,200 = $236
A positive result indicates that actual spending exceeds the estimate under this convention. A negative result indicates that actual spending is below the estimate.
You can also express the difference as a percentage:
Variance percentage = (Actual cost − Estimated cost) ÷ Estimated cost × 100
For the example, the variance is approximately 10.73% above the original estimate.
However, this calculation is only meaningful when the two amounts cover the same scope and reporting period.
A project that is 30% complete should not normally be judged against the full project budget using actual spending alone. Some costs may have been committed but not yet invoiced, while other planned expenses may not have occurred yet.
Where possible, compare costs at the same level of completion and use clearly defined reporting dates.
Step 5: Analyze Costs by Category and Project Phase
A total project figure can hide the reason for an overrun.
Suppose a project has a budget of $100,000 and recorded spending of $103,000. The overall variance is $3,000, but that number does not reveal which activity needs attention.
A category-level analysis might show:
- Materials: $4,000 above budget.
- Labor: $1,500 below budget.
- Equipment: $500 above budget.
These figures produce the same net overrun of $3,000, but they tell a more useful story. Material expenses are the largest source of the difference, and the labor underspend partially offsets it.
The next step is to investigate why material spending increased. Was the unit price higher? Did the project require additional quantities? Was there breakage or waste? Did the design change? Were delivery charges omitted from the original estimate?
The spreadsheet can identify where to investigate, but it cannot establish the cause without supporting evidence.
Use the same approach for project phases such as excavation, foundations, structural work, finishing, and landscaping. Comparing phases separately helps prevent an expensive activity from being hidden by savings elsewhere.
Step 6: Check Material Quantities Before Comparing Material Costs
Material analysis becomes more useful when the quantity and the unit price are both visible.
A higher material bill does not necessarily mean the supplier charged more. The project might have used more material than planned, or the original quantity estimate may have been incomplete.
For materials sold by volume, calculate the required volume using the dimensions and shape of the area. A rectangular area, for example, has a basic volume of:
Volume = Length × Width × Depth
The dimensions must use consistent units. If all three measurements are in feet, the result is in cubic feet. Divide cubic feet by 27 to convert to cubic yards.
For a practical calculation, the CY Calculator, a cubic yard calculator can help estimate volumes from project dimensions. It is useful for materials such as soil, gravel, mulch, sand, and concrete.
Consider a rectangular area measuring 20 feet long, 10 feet wide, and 0.5 feet deep.
20 × 10 × 0.5 = 100 cubic feet
100 ÷ 27 ≈ 3.70 cubic yards
This is the geometric volume based on the stated dimensions. The amount ordered may differ because of compaction, uneven ground, material specifications, waste, or the supplier’s ordering practices.
Do not assume that a cubic-yard estimate can be converted into a reliable weight without knowing the material’s density and condition. Loose gravel, compacted aggregate, and wet soil can have different weights per unit volume.
Keep quantities, unit prices, delivery costs, and allowances separate in the spreadsheet. This makes it easier to explain why the final cost differs from the original estimate.
Step 7: Build Charts That Answer Specific Questions
Charts should make a decision easier, not simply decorate the report.
A few practical options include:
- Budget versus actual bar chart: Compare estimated and actual costs for each category.
- Monthly spending line chart: Track expenditure over time and identify periods with unusual increases.
- Cost distribution chart: Show how much each category contributes to total spending.
- Project-phase comparison: Identify which stages account for the largest variance.
A chart should include a clear title, readable labels, the reporting period, and the unit of measurement. If the figures exclude taxes, contingency, or committed costs, say so.
Avoid using a percentage chart when the categories are not comparable or when negative values make the presentation misleading. A table can be clearer than a chart for a small number of items.
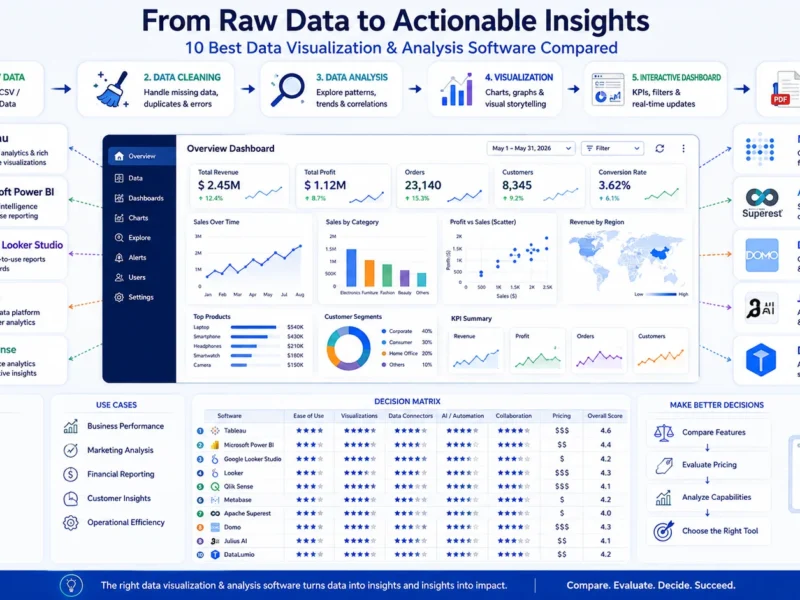
DataLumio’s data analysis platform can help users clean supported datasets, examine numerical information, create visual summaries, and organize findings into reports. Any automatically generated result should still be checked against the underlying records.
Step 8: Use the Findings to Improve the Next Estimate
Cost analysis is most valuable when it changes what the team does next.
If several projects show that delivery charges are regularly missing from early estimates, revise the estimating template. If material waste repeatedly exceeds the expected allowance, investigate the installation process, storage conditions, measurement methods, or ordering practices.
And If supplier prices fluctuate significantly, record quotation dates and check whether the estimate reflects current market conditions. The Federal Highway Administration’s estimating guidance discusses price volatility and other factors that affect construction estimates.
It is also useful to separate an approved scope change from an unexpected overrun. Additional work requested by the client should not be interpreted in the same way as waste or an unexplained price increase.
Keep a record of the original estimate, approved revisions, and the final cost. Over time, these records can help the team understand which assumptions tend to be accurate and which need improvement.
Common Mistakes to Avoid
- Comparing different scopes: A revised project estimate may include work that was not present in the original budget. Document the changes before interpreting the variance.
- Mixing units: Cubic yards, cubic feet, tons, hours, and individual pieces are not interchangeable. Convert quantities carefully and retain the original unit.
- Counting the same expense twice: Reconcile purchase orders, invoices, credits, and payments before calculating the total.
- Treating every underspend as a saving: Work may be incomplete, delayed, or missing from the records.
- Ignoring the reporting date: Costs recorded at different stages of a project cannot always be compared directly.
- Relying on charts without checking the data: An attractive dashboard cannot correct an incorrect formula or incomplete source record.
- Treating an estimate as a guarantee: Material prices, site conditions, and the scope of work can change.
Turning Construction Cost Data Into Better Decisions
Excel provides a practical foundation for organizing project costs, calculating variances, and identifying areas that need investigation. The value comes from combining accurate records with consistent categories and sensible comparisons.
Start with the original estimate, record actual costs as they occur, keep quantities and prices separate, and investigate the differences rather than assuming their causes. As the project grows, add charts and reporting workflows that help the team review the information without losing sight of the source records.
For teams that regularly work with spreadsheets, PDFs, and structured datasets, DataLumio offers a way to organize data cleaning, analysis, visualization, and reporting in one workspace.
The goal is not to make every project fit a complicated model. It is to make the financial information clear enough that the next decision is based on evidence rather than guesswork.